Trump Has Raised Little Money, Much Unitemized. SO SAD!

Much has been made today of Donald Trump’s lackluster fundraising productivity in May. I’m going to pile on here, because his campaign is an absolute fiasco in essentially every sense.

In lieu of a full analysis of what this means in terms of inference and prediction, here are three simple rankings/comparisons.  (For the full read of the data, see here: BernieHillary, Trump.)

Total contributions, through the entire cycle through May:

  1. Bernie: $224 Million.
  2. Hillary: $207 Million.
  3. Donald: $17 Million.

Candidates can loan money to their own campaign (meaning they can use campaign contributions to pay themselves back):

  1. Donald: $45 Million.
  2. Hillary: $0.
  3. Bernie: $0.

Third, donations to federal campaigns fall into two categories: itemized and unitemized.  Itemized donations are those that, in sum, for an individual, exceed $200.  Unitemized are those that sum to less than $200 for the donor.

With that said, the proportion of donations that are unitemized to date for each candidate:

  1. Donald: 72.9%
  2. Bernie: 59.0%
  3. Hillary: 21.6%

What does this indicate?

First, Bernie and Hillary are vastly outperforming Trump in terms of raising money.  VASTLY. There’s a bit of chicken and egg here, but the simple fact is that raising money requires a ground operation, and the data confirms observation that Hillary and Bernie have such operations in place, and Trump—well, not so much.

Second, Donald Trump is actually self-financing his campgin on the idea that he will get sufficient contributions to pay himself back.  Hillary and Bernie are not doing so.

Third, Hillary’s contributions are coming from “big” donors much more than are Donald’s (limited) contributions or Bernie’s (significant) contributions.  For Bernie, this makes sense: he is appealing to a swath of the US electorate that doesn’t generally have the wherewithal to donate $200 to a political campaign.

For Trump, maybe the same argument applies…Don’t know.  It’s just a very large ratio of unitemized contributions.  I’ll leave it there.

With this, and in light of the absolutely shameful failure of the Senate to undertake serious efforts at preventing gun violence yesterday, I leave you with this.

Extreme and Unpredictable: Is Ideology Collapsing in the Senate GOP?

The Republican Party is in crisis. This year’s presidential campaign is arguably evidence enough for this conclusion, but it is important to remember that there are really (at least) two “Republican Parties”: one composed of voters and another composed of Members of Congress.

A split in the broader GOP is troublesome for Republican elites because, among other things, it complicates the quest for the White House, which might also cause significant problems for Republican Members seeking reelection. But splits in the broader party do not necessarily affect governing. A split in the “party in Congress,” however, can greatly complicate governing. Indeed, one might argue that the beginnings of such a split caused the downfall of former Speaker Boehner, the government shutdown of 2013, and the near-shutdown of 2015.

As Keith Poole eloquently notes, the potential split in the GOP appears eerily similar to the collapse of the Whig Party in the early 1850s (the last time a major party split occurred in the United States). A key difference between the current Congress and those in the 1850s is the lack of a “second dimension” of roll call voting. Without going into the weeds too much, what this means is that there is no systematic splitting of the Republican party on a repeatedly revisited issue. In the 1850s, that issue was slavery (specifically how it would be dealt with as the nation admitted new states).

Because of this, our roll call-based estimates of Members’ ideologies essentially place all members on a single, left-right dimension. This implies that, for most contested roll call votes, most of the Republicans vote one way and most of the Democrats vote the other. The figure below, which displays the proportion of roll call votes in each Congress and chamber that pitted a majority of one party against a majority of the other, illustrates how this has become increasingly the case.

PartyLineVotes

Of note in the figure are two things. The first is the overall increase in party line voting since the civil rights era. Party line voting was rare during this era in part because the Republican party controlled relatively few seats in either chamber and, relatedly, because the Democratic party often split on civil rights legislation, with Southern Democrats relatively frequently voting with Republicans. As the South “realigned,” beginning in earnest with the 1980 election, the parties became more clearly sorted and party line voting became more common: with civil rights legislation largely off the table, fewer and fewer votes split either party.

The second thing to note is that party line voting dropped precipitously in 1997 (the first Congress of Bill Clinton’s second term), rose during George W Bush’s presidency, and unevenly surged during Obama’s first 3 Congresses. Thus, “partisan voting” is definitely not on the decline in recent years.  This is important for many reasons, but for our purposes it is important because it implies that the nature of “partisan warfare” has not qualitatively changed in terms of the structure of roll call voting, writ large.

Unpredictability and Ideology

Given a Member’s estimated ideology (“ideal point”), we can predict how that member should have voted on each roll call vote. (I am omitting some details.) Using this and the actual votes, we can calculate how many times each Member’s vote was “mispredicted” by the estimated ideal point.

In a nutshell, these are situations in which most of the other Members who have similar ideological voting records voted (say) “Yea,” members on the other side of the ideological spectrum voted “Nay” and the member in question voted “Nay.” For example, if all of the Democrats voted “Nay” on some roll call, and all of the Republicans other than Ted Cruz voted Yea, then Senator Cruz’s vote would be mispredicted by Cruz’s estimated ideal point (which is the most conservative among the current Senate).

Typically, this misprediction, or “error” rate is higher for Members who are (estimated to be) ideological moderates. This is for several reasons. First, if a member is simply voting randomly, then he or she would be estimated to be a moderate. Second, and more substantively, if a member is actually moderate, then his or her vote is more likely to be determined by non-ideological factors because his or her ideological preferences are relatively weaker than for someone who is ideologically extreme.

In any event, the figures below illustrate the House and Senate for a “typical” recent Congress, the 109th Congress (2005-6). In the 109th both chambers of Congress were controlled by the Republican Party, following the reelection of George W. Bush. In both figures, the horizontal axis is the estimated ideology so dots on the left represent liberals and dots on the right represent conservative), and the vertical axis is the proportion of votes cast by that member that were mispredicted by his or her estimated ideology. Each figure includes an estimated quadratic equation for “expected error rate.”[1]


109th-House 109th-Senate

In both figures, with one notable exception in the 109th House (Ron Paul (R, TX), Senator Rand Paul’s father), bear out the general tendency for moderates to have higher error rates than “strong” liberals and conservatives. [2]

What About Today? Let’s turn to the 114th Congress (through March 2016). Looking first at the House, the pattern from the 109th is still present.[3] Moderates are characterized by higher error rates than strong liberals or conservatives.

114th-HouseIn the 114th Senate (through March 2016), however, the picture is qualitatively and statistically different:
114th-SenateIn particular, the Republican party has generally higher error rates than does the Democratic party.[5] This indicates that Republican Senators have been more likely to vote against their party than have been Democratic Senators or, more substantively, the internal ideological structure of the Republican party in the Senate has played a smaller role in determining how GOP Senators have voted in this Congress.

Who’s Being Unpredictable?

Consider the list of the 15 Senators with the highest error rates:

Name State Error Rate Party Conservative Rank
PAUL Kentucky 21.2% GOP 3rd
COLLINS Maine 20.8% GOP 54th
MANCHIN West Virginia 18.1% Dem 55th
HELLER Nevada 17.7% GOP 29th
FLAKE Arizona 15.7% GOP 4th
KING Maine 15.3% Independent 60th
CRUZ Texas 15.1% GOP 1st
KIRK Illinois 15.0% GOP 51st
LEE Utah 14.9% GOP 2nd
MURKOWSKI Alaska 13.6% GOP 53rd
NELSON Florida 13.4% Dem 61st
PORTMAN Ohio 13.2% GOP 44th
MORAN Kansas 13.1% GOP 38th
MCCONNELL Kentucky 13.0% GOP 37th
AYOTTE New Hampshire 12.4% GOP 46th
HEITKAMP North Dakota 12.4% Dem 58th
MCCAIN Arizona 12.4% GOP 43rd
GARDNER Colorado 11.3% GOP 26th
GRASSLEY Iowa 11.1% GOP 48th
CORKER Tennessee 11.1% GOP 41st

Tellingly, the four most conservative Senators have incredibly high error rates (and two of these (Paul and Cruz) made serious runs for the GOP presidential nomination). The rest of the list is dominated by Republicans. The four non-GOP Senators are in fairly conservative states (with Maine being an unusual case).[6]

Hindsight and looking back… I don’t have time to get into the weeds even more with this at this moment. For now, I just wanted to point out that voting in the current Senate is unusual: Republicans are breaking with their party more often than are Democrats, and a handful of “extreme” conservatives are breaking with the party at incredibly (indeed, historically) high rates. To quickly see the recent past, consider the 113th Congress:

113th-Senate

In the last Congress, Republicans were already breaking with their party at qualitatively higher rates than were their Democratic counterparts, but there was no real analogue to the cluster of 4 extremely conservative Senators who have been mispredicted so strongly in the 114th Congress. One of those 4—Senator Flake (R, AZ) was a newly-arrived freshman Senator in the 113th Congress and has continued to be difficult to predict in his second Congress.

What does it mean? 

In line with both Keith Poole’s conclusion that the GOP shows significant signs of breaking up and the recent revolt among the GOP members in the House (where agenda setting is much more tightly centralized), I think what is happening is that (some of) the “estimated as conservative” wing of the GOP in the Senate is increasingly breaking party lines in pursuit of issues that are not being addressed by the chamber. Qualitative examples of such behavior are seen in the recurrent obstructionism among the “Tea Party wing” of the Republican party. (For example, see my theoretical work on this type of behavior and its electoral origins.) This rhetoric has also flared in the race for (both parties’) presidential nominations.

In line with this, of course, is the fact that the GOP has a disproportionately large number of Senators up for reelection in 2016. I haven’t had time to go through and compare the list of highly mispredicted Senators (please feel free to do so and email me about it!), but my hunch is that a bunch of “in-cycle” Senators are on that list.

For now, though, I leave you with this and this.

________________


[1] The quadratic term is significant (and obviously negative) in both chambers, as typical.

[2] The other Members with similarly high error rates in the House are Gene Taylor (D, MS), who would go on to be defeated 4 years later in the 2010 election, and Walter Jones (R, NC), who will show up again below: both were considered “mavericks” and were, as a result, estimated as being relatively moderate in ideological terms. In the Senate, the three highest error rates were (in order) Senator Mike DeWine (R, OH), who would be defeated in the 2006 midterm election by Sherrod Brown, Senator Arlen Specter (R, PA), a moderate Republican, and Senator John McCain (R, AZ).

[3] The quadratic term for the estimation of the relationship between estimated ideal point and error rate is again significant and of course negative.

[4] The quadratic term in this case is still negative, but no longer statistically significant. The linear term is positive, of course, and statistically significant.

[5] As is common in recent Congresses, there is no overlap between the parties’ ideological estimates so far this Congress: Senator Joe Manchin (D, WV) is the most conservative Democratic Senator, and Senator Susan Collins (R, ME) is the most liberal Republican Senator, but Senator Collins is estimated as being more conservative than Senator Manchin.

[6] Mitch McConnell is on this list for procedural reasons: he frequently votes “with” the Democrats on cloture motions when it is clear that cloture will fail, so as to reserve the right to motion to reconsider the vote in the future.


Comparing the Legislative Records of the Candidates

This is a guest post by David Epstein. 

Picture this: you are on a committee to hire a new CEO for a large, multinational firm. There are a number of qualified candidates, you are told, each of whom has many years of experience in the relevant field, and then you are handed a background folder on each of them. In the folder you find detailed statements of what they would like to do with the company if they are hired.

So far so good, but when it comes to the candidates’ histories, the folder talks only about their deep formative experiences from when they were children, along with some amusing anecdotes from their lives over the past few years. Nowhere, though, does it tell you how these candidates have actually performed in their professional careers. Have they been CEO’s before? If so, how did their companies do? What projects have they tackled in the past, and what were the outcomes? All excellent questions, but nothing in the files provides any answers.

This is the situation voters find themselves in every four years when choosing a president. They are told what policies the candidates promise to enact if elected, sometimes with an evaluation of how realistic and/or desirable those policies would be. But nowhere, for the most part, are they given the candidates’ backgrounds in jobs similar to the one they are running for. (An outstanding exception to this rule is Vox’s review of Marco Rubio’s tenure as Speaker of the Florida House of Representatives.)

The Task Ahead

Here, I will begin to remedy this gap by comparing the legislative records of the four candidates who have spent time in the Senate: Sanders, Clinton, Rubio and Cruz. Sanders has proposed a “revolutionary” set of reforms; how likely is he to be able to make them into policy? Clinton spent twice as long as a senator from New York than as Secretary of State, but somehow that chapter in her political history is rarely spoken about. Rubio and Cruz are newer to the Senate, Rubio more of an establishment legislative figure (at least at first), and Cruz more clearly ideological. Do either of them have histories of getting their policies passed? And yes, it’s true – Rubio and Cruz have now dropped out of the race. But a) they might still be on the ballot as VP candidates, and b) it is interesting to compare them with the Democrats, as explained below.

Now, no one set of measures can completely capture how well a legislator does their job. I’ll be examining statistics having to do with proposing, voting on, and passing legislation, which might be considered legislators’ core activities. But members of Congress also must spend time doing constituency service, sitting on committees and subcommittees, appearing in the media, and more. And, of course, what of the candidates who were executives (governors) previously — how should we measure their performance? This analysis isn’t meant to be the final word on the subject; rather, it should provide some interesting material to consider and, hopefully, open a wider discussion on assessing candidates’ qualifications for the presidency.

TL;DR: Clinton comes out looking good in terms of effectiveness and bipartisan cooperation, and Rubio does surprisingly well for his first term, sliding down after that. Sanders had a burst of activity from 2013-14, but his years before and after that aren’t very impressive. Cruz’s brief time in the Senate has been almost completely unencumbered by working to pass actual legislation.

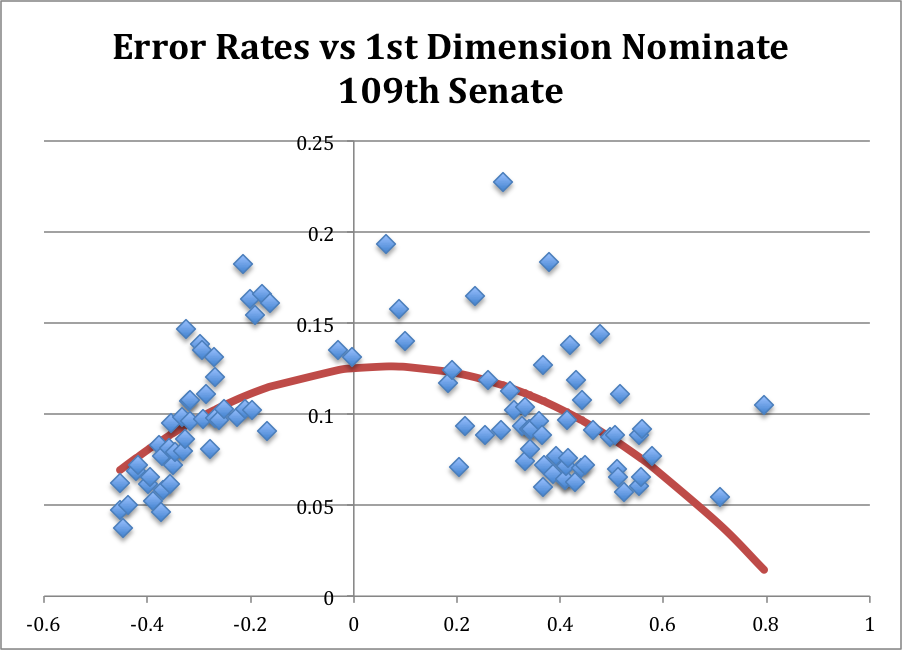
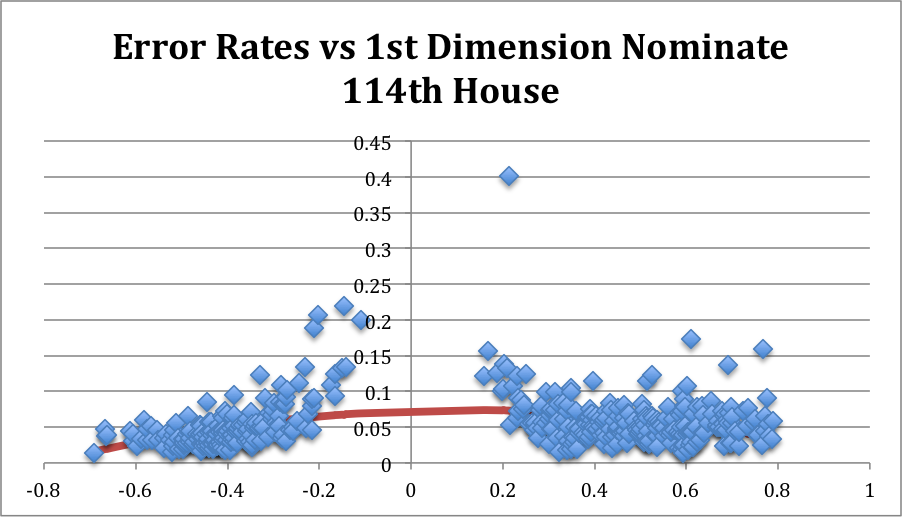
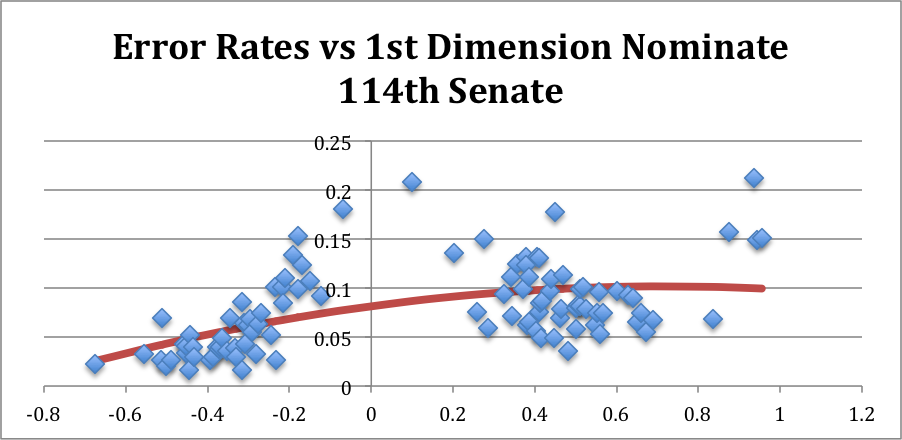
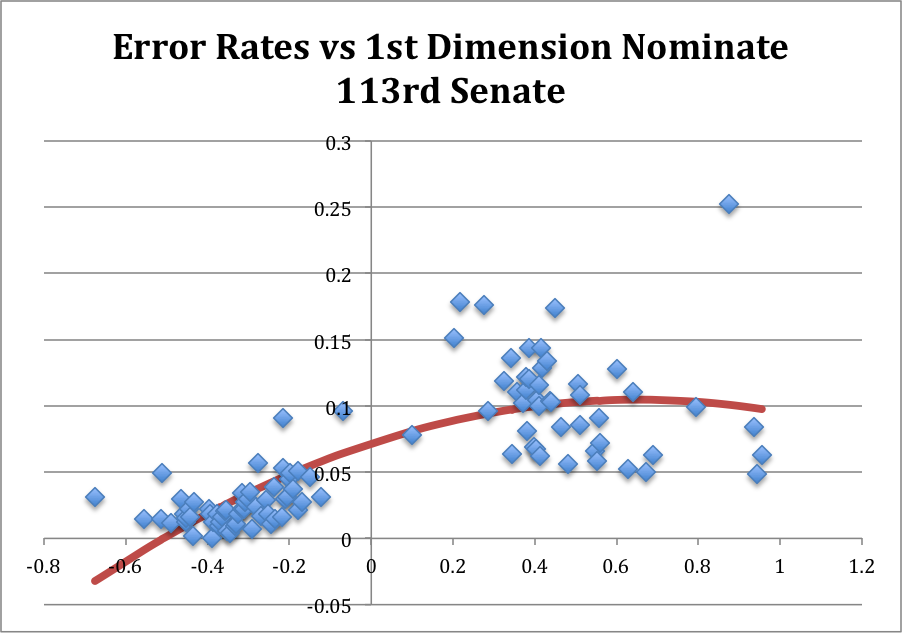
Left-Right Voting Records

Let’s start by looking at how liberal/conservative the candidates’ voting patterns were while in office. Political scientists have developed a scale for measuring the left-right dimension of voting, called the Nominate score. I ranked these scores by Congress, with 1 indicating the senator with the most liberal voting record, and 100 being the most conservative. [NB: Each Congress lasts two years, with the 1st going from 1789-1790, and so on from there. For our purposes, the relevant Congresses stretch from the 107th (2001-02) to the current 114th Congress (2015-16). Since the 114th isn’t over yet, its statistics should be correspondingly discounted relative to the others.]

As shown in the table below, the four candidates form almost perfectly symmetric mirror images of each other. Clinton was around number 15 during her four terms in the Senate, while Rubio was 85. So each of them, despite being tagged as the “establishment” or “moderate” candidates in the primaries, was each more extreme than the average member of their own parties. That is, Clinton voted in a reliably liberal direction, even more so than the majority of her Democratic colleagues, while the same holds true for Rubio vis-à-vis the Republican senators.

Congress State Name Rank
107 NEW YORK CLINTON 14
108 NEW YORK CLINTON 15
109 NEW YORK CLINTON 13
110 VERMONT SANDERS 1
110 NEW YORK CLINTON 15
111 VERMONT SANDERS 1
112 VERMONT SANDERS 1
112 FLORIDA RUBIO 85
113 VERMONT SANDERS 1
113 FLORIDA RUBIO 86
113 TEXAS CRUZ 100

The Candidates, Ranked by the “Liberalness” of their Senate Voting
(1: Most Liberal, 100: Most Conservative)

Sanders and Cruz also form a perfect pair of antipodes. Sanders had the most liberal voting record for each of his terms, while Cruz was the most conservative. As a note: the only time that a party’s nominee had the most extreme voting record in their party was George McGovern in 1972 –- draw your own conclusions.

The symmetry is broken, however, when you consider the states the candidates represent(ed). Vermont is by many opinion poll measures the most liberal state in the country, and Clinton’s rank almost perfectly reflects New York’s relative position as well. Cruz and Rubio, on the other hand, have voting records considerably more conservative than Texas (number 33 out of 50 in conservative opinions of its voters) or Florida (number 23 out of 50) residents, respectively.

Bill Passage

Voting analysis can give us clues to the kind of policies a president might pursue in office. But can they get legislation passed? The next two figures show the number of bills and amendments introduced by each candidate, and the number of those that eventually passed into law, along with the overall average for each Congress.

BillsAndLaws-Epstein

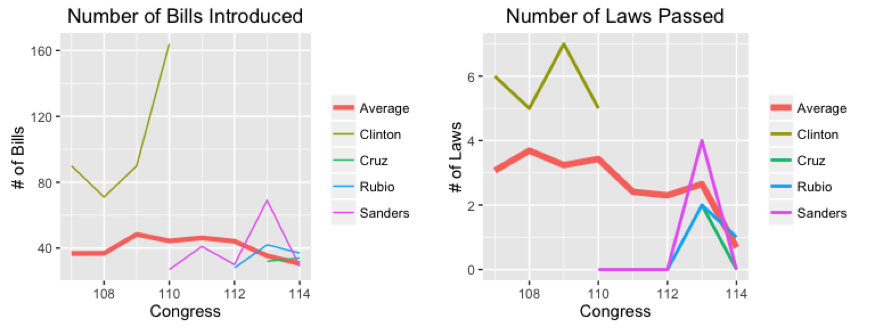
Note first that, although the average number of bills introduced has stayed more or less constant over time, the number actually passed has taken a nosedive in recent years. This reflects the increased partisan divisions in Congress, as well as the electorate, that have made Obama’s second term one where policy change may happen via executive actions or rulings in important Supreme Court cases, but rarely via the normal legislative route.

In terms of the various candidates, Clinton was by far the most active in terms of introducing and passing legislation; her totals are significantly above congressional averages for each of her terms in office. This makes sense in terms of her political history: Clinton entered the Senate in 2001 with a lot to prove — she had won just 15 of New York’s 62 counties in her 2000 election victory and wanted to establish herself as a legislator who could get things done. She worked hard, especially pushing programs that benefitted upstate New York’s more rural, agricultural economy, and was rewarded in 2006, winning re-election handily with a majority in 58 counties.

Sanders, on the other hand, has fewer legislative achievements to his name. He had a spurt of activity in the 113th Congress (2013-14), where, perhaps looking forward to his upcoming presidential bid, he introduced 69 measures, four of which passed into law. As noted above, Sanders has consistently represented his state’s liberal voters, but while the policies he has proposed may have been popular at home, in general they have not won sufficient support to be enacted into law.

Cruz and Rubio are about average in terms of measures introduced and below average for number passed. Neither, to date, has a major legislative initiative to their name. But see the next section, for Rubio’s record has more to it than it seems.

Co-Sponsorship

Actually passing policy means getting others to support your positions, and in today’s environment that entails getting members of the opposite party to vote in favor of your proposals, at least every once in a while.

Thus we now turn to analysis of cosponsorship trends. When a bill or amendment is introduced by a member of Congress — making them the “sponsor” of that measure — other members of their chamber can register their support for it by adding themselves as “co-sponsors.”

As the figure below shows, even though Clinton was far ahead of the others in terms of getting her bills passed into law, she did not have an especially high number of cosponsors per bill, on average. Neither did any of the other candidates, with the notable exception of Rubio in his first few Congresses.

Cosponsors-Epstein

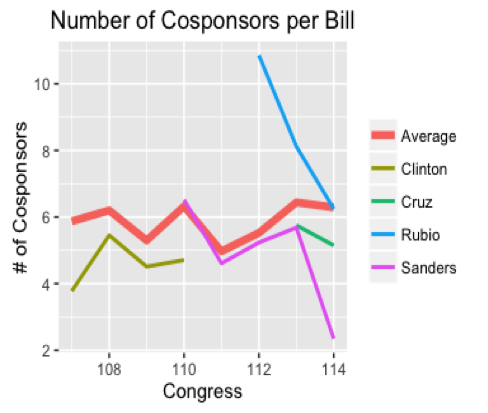
As the chart shows, the few measures that he introduced in his first years in office were relatively high-profile, gaining the support of a number of colleagues. However, the efforts produced few results, one example being the immigration reform bill he introduced as a member of the bipartisan “gang of eight” after the 2012 elections. Thus Rubio’s time in the Senate — somewhat similar to his presidential campaign — started out with a flurry of activity but then faded out, as he failed to assemble coalitions to get behind his proposals.

To measure the candidates’ track records of creating bipartisan coalitions, we look at two measures of their ability to attract the support of their colleagues from across the aisle. First, the percent of cosponsors who come from the opposite party. Second, a measure of “cosponsor coverage,” meaning the number of senators who cosponsored at least one measure proposed by the given candidate in the course of a single Congress.

Cosponsor-Coverage-Epstein

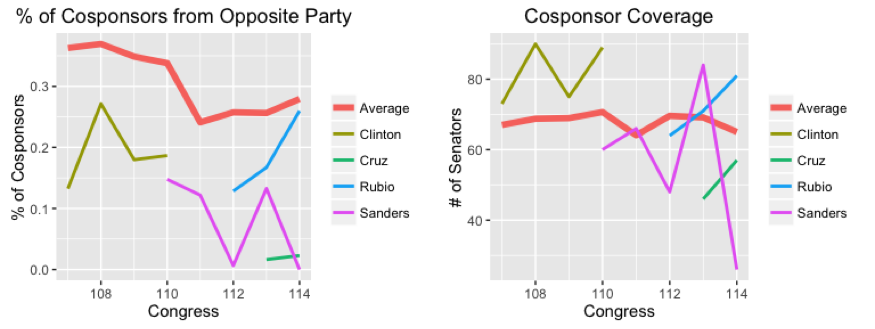
All of the candidates perform a bit below average in the percent of cosponsors from the opposite part, with Clinton and Rubio again doing better than Sanders or Cruz. And in the coverage measure, Clinton is relatively high, with Sanders and Rubio close on her heels (except for the most recent Congress, where Sanders has almost no cosponsors for the measures that he has introduced). Cruz is especially low in coverage, gaining three Democratic supporters in his first term, and four in this, his second term. Of course, Cruz has spent his time in the Senate mainly working to oppose existing policies (via government shutdowns and filibusters) rather than create new ones, so this is not too surprising.

Conclusions

Of course, there has been one other sitting senator — the first since John F. Kennedy in 1960 — elected to the presidency, and that is Obama, who spend four years in the Senate prior to his election in 2008. (Nixon spent two years in the Senate before becoming Eisenhower’s VP, and Lyndon Johnson was a senator when he became Kennedy’s VP.) What would this analysis have said about him?

Obama’s voting record was a tad more conservative than Clinton’s — number 18 on the list compared to her 15 — but he also represented a slightly less liberal state than she did. He proposed an average of 68.5 bills each Congress, which is higher than average, but he only passed a below-average 1.5 bills per Congress. Thus Obama had a lot of ideas about what to do, but didn’t yet have the track record of being able to work with his fellow senators to bring these ideas to fruition.

Interestingly, Obama’s bipartisan measures are all average or above average compared to the other candidates, so while trying to garner support for his bills he was able to work with Republicans fairly well. This would probably have made it even more of a surprise when, once he took office, the Republican party as a whole refused to work with him in any fashion to pass his policy agenda.

Who’s Got The Power? Measuring How Much Trump Went Banzhaf On Tuesday

The Democratic and Republican Parties each use a weighted voting system to choose their presidential nominees.  This only matters when no candidate has a majority of the delegates, and the details are complicated because the weight a particular candidate has is actually a number of (possibly independent) delegates.  Leaving those details to the side, let’s consider how much Donald Trump’s wins on Tuesday April 26th “mattered.”  The simplest measure of success, for each candidate, is how many additional delegates they each won.  As a result of Tuesday’s primaries, Trump is estimated to have picked up 110 delegates, Senator Cruz is estimated to have picked up 3, and Governor Kasich similarly is estimated to have picked up 5.

A key concept in weighted voting games is that of power.  There are literally countless ways to measure power, but one of the most popular ways is called the Banzhaf index.

If there are N total votes, and a candidate “controls” K of those votes, the Banzhaf index measures the probability, given the distribution of the other N-K votes across the other candidates, that the candidate in question will cast the decisive vote: that is, that he or she will have enough votes to pick the winner, given every way the other candidates could cast their ballots. (I’m skipping some details here.  For the interested, the most important detail is that the index presumes that the other candidates will randomly choose how to vote.)

A higher power index implies that the candidate is more likely to determine the outcome. What is key is that the power index for a candidate with K votes out of N is generally not equal to \frac{K}{N}.  For example, if a candidate has over half of the votes,[1] then that candidate’s Banzhaf index is equal to 1 (and those of all other candidates are equal to zero, and we’ll see that come up again below), because that candidate will always cast the decisive vote.

So, back to Tuesday.  Here is the breakdown of how the GOP candidates’ delegates translated into “Banzhaf power” before Tuesday’s primaries.

Candidate Donald Trump Ted
Cruz
John Kasich Marco Rubio Ben Carson Jeb
Bush
Carly Fiorina Rand Paul Mike Huckabee Total 
Delegates 846
(48.85%)
548
(31.64%)
149
(8.6%)
173
(9.99%)
9
(0.52%)
4
(0.23%)
1
(0.06%)
1
(0.06%)
1
(0.06%)
1,732
Banzhaf Power 0.5 0.1667 0.1667 0.1667 0.1667 0 0 0 0

Going into Tuesday’s primaries, Trump held just under majority of the delegates and held exactly half of the power.  More interesting in this comparison is that Marco Rubio’s power was still significant: in fact, equal to the individual powers of Kasich and Cruz.

Even though Rubio and Kasich each had less than a third of Cruz’s delegates, their voting power as of Monday was equal to Cruz’s. This is due to the fact that Rubio, Kasich, and Cruz could defeat Trump if and only their delegates voted together, regardless of how the other delegate-controlling candidates had their candidates vote.  In other words, Carson, Bush, Fiorina, Paul, and Huckabee truly had—as of Monday (and today)—no bargaining power at a contested convention.

However, after Tuesday’s results, the following happened:

Candidates Donald Trump Ted
Cruz
John Kasich Marco Rubio Ben Carson Jeb
Bush
Carly Fiorina Rand Paul Mike Huckabee Total
Delegates 956
(51.68%)
551
(29.78%)
154
(8.32%)
173
(9.35%)
9
(0.49%)
4
(0.22%)
1
(0.05%)
1
(0.05%)
1
(0.05%)
1,850
Banzhaf Power 1 0 0 0 0 0 0 0 0

By securing a majority of the delegates allocated so far, Trump’s power jumped from 0.5 to 1 and all of his opponents’ powers dropped to zero.  If the convention occurred today, they would be powerless to stop Trump.

Now, suppose that the candidates had votes equal to the actual votes (rather than delegates) they receive.  If the convention were held today under such rules, this would result in the following:

Candidates Donald Trump Ted
Cruz
John Kasich Marco Rubio Ben Carson Jeb
Bush
Jim Gilmore Chris Christie Carly Fiorina Rand Paul Mike Huckabee Rick Santorum Total
Popular Votes 10,121,996
(39.65%)
6,919,935
(27.10%)
3,677,459
(14.40%)
3,490,748
(13.67%)
722,400
(2.83%)
270,430
(1.06%)
2,901
(0.01%)
55,255
(0.22%)
36,895
(0.14%)
60,587
(0.24%)
49,545
(0.19%)
16,929
(0.07%)
25,530,125
Banzhaf Power 0.5 0.1667 0.1667 0.1667 0 0 0 0 0 0 0 0

If the popular votes were the basis of the GOP nomination and the convention were held today, then the candidates would still have the same “powers” as they did prior to Tuesday’s primaries.  Thus, on Tuesday, we arguably truly witnessed the effect of the “delegate system.”

As a final note, this power calculation clearly indicates something that I think is underappreciated about multicandidate races in majority rule settings.  To break Trump’s lock on the race, it is unimportant which candidate (other than Trump) an “unpledged” delegate decides to support.  Right now, if and only if at least 62 unpledged delegates (and I have no idea how many of them there are left right now) decide to support “other than Trump,” then the Trump’s power drops below.  In addition to (and in line with) the fact that it doesn’t matter how those delegates allocate their support across the other candidates, if 62 such delegates appeared in the hypothetical conference tomorrow in Cleveland, the powers of the candidates would be as follows:

Candidates Donald Trump Ted
Cruz
John Kasich Marco Rubio Ben Carson Jeb
Bush
Carly Fiorina Rand Paul Mike Huckabee Total
Delegates 956
(50%)
613
(32.06%)
154
(8.05%)
173
(9.05%)
9
(0.47%)
4
(0.21%)
1
(0.05%)
1
(0.05%)
1
(0.05%)
1,912
Banzhaf Power 0.97 0.004 0.004 0.004 0.004 0.004 0.004 0.004 0.004

Conclusion. There are two “math of politics” points in here. The first is that votes/delegates are definitely not a one-to-one match: indirect democracy is distinct from direct democracy—it’s always important to remember that.  The second, and more “math-y” is that, when people have different numbers of votes, it is not the case that the number of votes a person has is equal to his or her voting power.[2]

With that, I leave you with this.

PS: If you would like (Mathematica) code to calculate the Banzhaf index for this and other situations, email me.

___________

[1] I am assuming for simplicity throughout, in line with the rules of the GOP and Democratic Party, that the collective decision is made by simple majority rule.  One can calculate the Banzhaf index for any supermajority requirement as well.  As the supermajority requirement goes up, the power indices of all candidates with a positive number of votes converge to equality (guaranteed to occur when the decision rule is unanimity).

[2] For a great review of how this is important in the real world, see Grofman and Scarrow (1981), who discuss a real-world use of weighted voting in New York State back in the 1970s.

Trump, Cruz, Rubio: The Game Theory of When The Enemy of Your Enemy Is Your Enemy.

I posted earlier about truels and how the current GOP nomination approximates one.  In that post, I laid out the basics of the simple truel (i.e., a three person duel), assuming that the three shooters shoot sequentially.  Things can be different when the three shooters shoot simultaneously.[1]  Short version: Trump and Rubio aren’t allies, but game theory suggests they should both attack Cruz, in spite of this.

This is arguably a better model for debates than the sequential version, in which candidates prepare extensively prior to debate, largely in ignorance of the other debaters’ preparations. Leaving that interesting question aside, let’s work this out.  I assume that the truel lasts until only one shooter is left, and that each shooter wants to live, and is otherwise indifferent.  I’ll also assume that the best shooter hits with certainty.[2] The probability that the second-best shooter hits his or her target is 0<p<1 and the probability that the worst shooter hit his or her target is 0<q<p.

When there are two shooters left, each will shoot at the other.  Not interesting, but important, because this implies that the worst shooter wants to shoot at the best shooter in the first round. In the first round, both the second-best and worst shooters shoot at the best shooter.  Either the first best or second best shooter will be dead after this (if the second-best and worst shooter each get to shoot before the first best shooter, but miss, then the second-best shooter will be killed with certainty). There is also a chance that the worst shooter will win in the first round: the best shooter kills the second-best shooter (probability 1/3), and the worst shooter kills the best shooter (probability q<1).

What does this say about the GOP race?  Both Rubio and Trump should be shooting at Cruz.  This is a simplistic model, and it ignores a lot of real-world factors.  But that’s why it’s valuable, from a social science perspective: if (and when) the behaviors of the three campaigns deviate from this behavior, we know that we need to include those other factors.  Until then, you see, in this world there’s two kinds of models, my friend: Those with just enough to capture the logic and those who need to dig for more things to include.  We’ll see if this one needs to dig.

With that, I leave you with this.

____________________

[1]. For simplicity, I will assume that, if two shooters shoot at each other, then one of them, randomly chosen, will “shoot first” and, if he or she kits, kill the other shooter before he or she fires his or her weapon.  Note that, with this assumption, if shooter A knows that shooter B (and only shooter B) is going to shoot at shooter A, then shooter A should definitely shoot at shooter B.

[2]This assumption isn’t as strong as it appears. This is because the truel is already assumed to continue until only one player is left (note that it is impossible for zero shooters to survive, given the tie-breaking assumption).

The GOP’s Reality is Truel, Indeed

truel is a three person duel.  There are lots of ways to play this type of thing, but the basic idea is this: three people must each choose which of the other two to try to kill.  They could shoot simultaneously or in sequence.  The details matter…a lot.  I won’t get into the weeds on this, but let’s think about the GOP race following last night’s Iowa caucus results.  By any reasonable accounting, there are three candidates truly standing: Ted Cruz, Marco Rubio, and Donald Trump.  The three of them took, in approximately equal shares, around 75% of the votes cast in the GOP caucus.

The next event is the New Hampshire primary, and the latest polls (all conducted before the Iowa caucus results) have Trump with a commanding lead and Rubio and Cruz essentially tied for (a distant) second.  So, the stage is set.  Who shoots first?  And at whom?

The truel is a useful thought experiment to worm one’s way into the vagaries of this kind of calculus.  A difference between truels and electoral politics is that the key factor in a standard truel is each combatant’s marksmanship, or the probability that he or she will kill an opponent he or she shoots at.  What we typically measure about a candidate is how many survey respondents support him or her.  For the purposes of this post, let’s equate the two.  Trump is the leader, and Rubio and Cruz are about equal.

A relatively robust finding about truels is that, when the shots are fired sequentially (i.e., the combatants take turns), each combatant should fire at the best marksman, regardless of what the other combatants are doing (this is known as a “dominant strategy” in game theory).  Thus, if we think that the campaigns are essentially taking turns (maybe as somewhat randomly awarded by the vagaries of the news cycle and external events), then both Rubio and Cruz should be “shooting at Trump.”  This is in line with Cruz’s post-caucus speech in Iowa last night.

An oddity of this formulation of the truel is that it is possible that the best marksman is the least likely to survive.  This is true even if the best marksman gets to shoot first.

Is it current, or future, popularity? An alternative measurement of marksmanship, however, is not the current support, but the perceived direction of change in support.  After all, marksmanship is about the ability to kill someone on the next shot.

On this front, Rubio is currently the better marksman: his support in Iowa vastly exceeded expectations, while by many accounts (though not necessarily my own), Trump is the worst marksman.  If one buys this alternative measure, then the smart strategy for both Trump and Cruz is to “aim their guns” at Rubio.  We have a week to see who they each aim at.

Of course, a truel is a simplistic picture of what’s going on in the GOP nomination process. In reality, it is probably better to think that each candidate’s marksmanship depends on his (or her) choice of target.  Evidence suggests that it is harder for Trump to “shoot down” Cruz than it was for him to shoot down Bush.  Maybe I’ll come to that later.  For now, I’m still making sense of Santorum’s strategy of heading to South Carolina. For that matter, I’m trying to make sense of him being called “a candidate for President.”

With that, I leave you with this.

The Patriots Are Commonly Uncommon

This is math, but it isn’t politics.  This is serious business.  This is the NFL.

The New England Patriots won the coin toss to begin today’s AFC championship game against the Denver Broncos. With that, the Patriots have won 28 out of their last 38 coin tosses. To flip a fair coin 38 times and have (say) “Heads” come up 28 or more times is an astonishingly rare event. Formally, the probability of winning 28 or more times out of 38 tries when using a fair coin is 0.00254882, or a little better than “1 in 400” odds.

But the occurrence of something this unusual is not actually that unusual. This is because of selective attention: we (or, in this case, sports journalists like the Boston Globe‘s Jim McBride) look for unusual things to comment and reflect upon. I decided to see how frequently in a run of 320 coin flips a “window” of 38 coin flips would come up “Heads” 28 or more times. I simulated 10,000 runs of 320 coin flips and then calculated how many of the 283 “windows of 38” in each run contained at least 28 occurrences of “Heads.” (For a similar analysis following McBride’s article, considering 25 game windows, see this nice post by Harrison Chase.)

The result? 441 runs: 4.41%, or a little better than “1 in 25” odds. (Also, note that the result would be doubled if one thinks that we would also be just as quick to notice that the Patriots had lost 28 out of the last 38 coin tosses.)

The distribution of “how many windows of 38” had at least 28 Heads, among those that contained at least one such window, is displayed in the figure below. (I omitted the 9,559 runs in which no such window occurred in order to make the figure more readable.)

CoinTossFig1

Figure 1: How Many Windows of 38 Had At Least 28 Heads


Accounting for correlation. Inspired partly by Harrison Chase’s post linked to above, I ran a simulation in which 32 teams each “flipped against each other” exactly once (so each team flips 31 times), and looked at the maximum number of flips won by any team. This relaxes the assumption of independence used in both the first simulation and, as noted by Chase, the Harvard Sports Analysis Collective analysis linked to above. I ran this simulation 10,000 times as well. I counted how many times the maximum number of flips won equaled or exceeded 23, which is the number of times the Patriots won in their first 31 games of the current 38 game window (i.e., through their December 6th, 2015 game against the Eagles).

The result? In 1,641 trials (16.41%), at least one team won the coin flip at least 23 times.

The Effect of Dependence. Intuition suggests that accounting for the lack of independence between teams’ totals decreases the probability of observing runs like the Patriots’. To see the intuition, consider the probability two teams both win their independent coin flips: 25%, and then consider the probability both teams “win” a single coin flip: 0%.

My simulations bear out this intuition, but the effect is bigger than I suspected it would be. Running the same 10,000 simulations assuming independence, at least one team won the coin flip at least 23 times in 2,763 trials (27.63%).

The histograms for the maximum number of wins in each of the 10,000 simulations, first for the “team versus team dependent” case and the second for the “independent across teams” case, are displayed below.

CoinTossFig2

Figure 2: Maximum Number of Coin Flip Wins by A Team in Round-Robin 32 Team League Season


CoinTossFig3

Figure 3: Maximum Number of Wins Among 32 Teams Flipping A Coin 31 Times

Takeaway Message.  Of course, anything that occurs around 5% of the time is not an incredibly common occurrence, but it illustrates that, it’s not that unusual for something unusual to occur. For example, note that the NFC once won the Super Bowl coin toss 14 times in a row (Super Bowls XXXII to XLV), an event that occurs with probability 0.00012207, or a little worse than “1 in 8000” odds. And, of course, we recently saw a coin flip in which the coin didn’t flip.

An empirical matter: somebody should go collect the coin flip data for all teams.  One point here is that looking at one team probably makes this seem more unusual, and the first intuition about the math might suggest that we can simply gaze in awe at how weird this is.  But, upon reflection, we should remember that we often stop to look at weird things without noting exactly how weird they are.

____________________________

Notes.

  1. The probability 0.00254882 in the introduction is obtained by calculating the CDF of the Binomial[38,0.5] distribution at 27, and then subtracting this number from 1.  A common mistake (or, at least, made by me at first) is to calculate the Binomial[38,0.5] distribution at 28 and subtract this number from 1. Because the Binomial is an integer valued distribution, that actually gives the probability that a coin would come up Heads at least 29 times. The difference is small, but not negligible, particularly for the point of this post (considering the probability of a pretty rare event occurring in multiple trials).
  2. 320 flips is 20 years of regular season games. Not that the streak is constrained to regular season games. I like Chase Harrison’s number (247, the number of games Belichick had coached the Patriots at the time of his post) better, but I didn’t want to re-run the simulations.
  3. The probability of this “notable” event is even higher if one thinks that the we would be paying attention to the event even if the Patriots had won only (say) 27 of the last 38 flips.
  4. I did the simulations in Mathematica, and the code is available here.

One Thing Leads to Another: “Delaying“ DA-RT Standards to Discuss Better DA-RT Standards Will Be Ironic

In response to the concerns raised by colleagues (principally and initially in this petition, but see also Chris Blattman’s take and other responses from both sides), I wanted to clarify why I think that delaying implementation of the Journal Editors’ Transparency Statement (JETS) is a poorly thought out goal, one that will differentially disadvantage some scholars, particularly younger, less well-known scholars.

These Standards Are Already Being Implemented. To begin, and reiterate one of the arguments I made here a few days ago, journal editors already have the unilateral discretion to impose the kinds of policies that JETS is calling upon editors to implement. To wit, editors are already implementing policies along these lines. For example, see the submission/replication guidelines of the American Journal of Political Science, American Political Science Review, and the Journal of Politics, to name only three. These three vary in details, but they are consistent with JETS as they stand right now.

It’s Happening Anyway, Let’s Stay In Front of It.  The point is that the JETS implementation is already under way and, indeed, was underway prior to the drafting of JETS. The DA-RT initiative is simply providing a public good: a forum for exactly the conversations that the petition signers seek. (The individuals who have contributed time to the public good that is DA-RT, and their contributions, are described here.)

The Clarifying Quality of Deadlines. The “implementation of JETS” scheduled for January 2016 is best viewed as a moment of public recognition that we as a discipline need to continue the conversations. Editorial policies are not written in stone, after all. Thus I strongly believe that delaying the implementation of JETS will do nothing other than further muddy the waters for scholars. JETS is about recognizing and shepherding the movement towards more coherent and uniform procedures to increase the transparency of social science research. Delaying it will place scholars, particularly junior and less well-known scholars, at a disadvantage. This is because implementation of the JETS will give all scholars firmer ground to stand on when seeking clarification of the details of a journal’s replication and transparency requirements.

Clear Policies Level the Playing Field and Make Editors (more) Accountable. Furthermore, scholars will be able to publicly compare and contrast these procedures, allowing more judicious selection of research design, early preparation of justifications for requests for exemptions, and finally, a counterpoint for an editorial decision that is inconsistent with the standards of peer outlets. That is, if journal X decides that one’s research is sufficiently transparent and then journal Y decides otherwise, the transparency of those journals’ standards—which JETS aims to ensure are publicly available—will ensure that the journals’ standards are fair game for comparison and debate. This is the type of conversation sought by many of the petition signers I have spoken with. Implementation of JETS will push this conversation forward, whereas delay will simply retain the status quo of an incoherent bundle of idiosyncratic policies.

Will The Sun Rise on January 15, 2016? It is important to keep in mind that the implementation of the JETS statement will in most cases result in no new policy: journal editors have been setting and fine-tuning standards like these for decades. Rather, implementing JETS binds editors—like myself—more closely to the sought-after conversations about how best to achieve transparency in the various subfields and with respect to the various methodologies of our discipline.

In other words, implementation of JETS will empower scholars to demand more transparency and accountability from the editors of the 27 journals that have signed the statement.

With that, I leave you with this.

Responding To A Petition To Nobody (Or Everybody)

Hey, long time no see. While we’ve been apart, there’s arisen a bit of a dustup in my little corner of the world about the Data Access and Research Transparency (DA-RT) initiative. In a nutshell, DA-RT represents a movement to continued discussion, implementation, and fine-tuning of standards regarding how social science research is produced and shared amongst scholars and the broader community.

In (quite belated) response, this petition dated November 3rd, 2015, requests a delay in the implementation of “DA-RT until more widespread consultation can be accomplished at, for instance, the regional meetings this year, and the organized section meetings and panels and workshops at the 2016 annual meeting.”

With the background set, a disclosure/explanation is in order: I am a coeditor of the Journal of Theoretical Politics, and hence a co-signatory on the DA-RT Journal Editors’ Transparency Statement (JETS).  That’s basically why I’m writing this, particularly once one reads the petition twice and realizes that, its length and detail notwithstanding, it is entirely unclear to whom the petition is directed (other than “colleagues”).

In practical terms, is this a petition to

  1. Journal editors?
  2. Journal publishers?
  3. Journals’ editorial boards?
  4. Journal reviewers?
  5. The governing bodies of the various political science associations?
  6. Political scientists in general?

In the spirit of this blog and my own view of the world, I’ll be clear:

the absence of a clearly named target of the petition is absolutely and definitively telling: this is not a serious (or at least well thought-out) plea. Full. stop.

Delay, delay, delay.  Without impugning any of the signers of the petition, it is clear to me that the petition is classic and barely disguised foot-dragging. This petition, as drafted, will do nothing to further serious dialogue about the issues at hand. Rather, it draws a (sadly, frequently and unnecessarily drawn) line in the sand between quantitative and qualitative analyses in the social sciences.

Transparency is hard for everybody.  The petition states that “Achieving transparency in analytic procedures may be relatively straightforward for quantitative methods executed via software code.” Sure, it might be. But it need not be. Difficulties with implementing transparency are qualitatively common to all forms of analysis: formal, quantitative, and qualitative. Formal analysis can depend on methods, proofs, or arguments that are obscure or opaque even to many scholars. Along the same lines, both quantitative and qualitative methods can be difficult to convey in a parsimonious fashion. Finally, both quantitative and qualitative analyses can bring up questions about how to preserve anonymity of subjects, maintain incentives for the collection of new data (“embargoing”), etc.

Let’s keep talking…at, you know, some place and some time. Each of the above issues is difficult to deal with, of course. But rather than acknowledging this (clear) reality and putting something productive forward, the petition instead suggests that “we” should delay implementation

 “until more widespread consultation can be accomplished at, for instance, the regional meetings this year, and the organized section meetings and panels and workshops at the 2016 annual meeting. Postponing the date of implementation will allow a discipline-wide consideration of the principles of data access and research transparency and how they should be put into practice.”


To understand why this is foot-dragging, note first this “Response by the DA-RT organizers to Discussions and Debates at the 2015 APSA Meeting” (henceforth “the Response”). Seriously, if you’re already here in this post, you should take the time to read it. It’s not that long, but it’s got a lot of information.

Finished reading it?  Good.  Let’s move on to what I think is the money shot of the Response, and it’s adroitly situated right in the opening:

At the 2015 Annual Meeting of the American Political Science Association in San Francisco, DA-RT and JETS were a central topic at several meetings. There were multiple workshops, roundtables, and ad hoc discussions. In addition, transparency was debated at several of the organized section business meetings. As a result, conversations about openness took place on almost every day of the Annual Meeting. As facilitators of a now five-year long dialogue on openness, we were of course delighted that the topic received such a wide airing. (Emphasis added and doubled.)


All that said, the petition asks for more discussions: “discussions” that are neither organized nor even clearly described. Just a vague call for “let’s talk some more at some of those meetings that we’ll all be at in the next year or so.”

But, wait…to stop piling on and return to the facts as stipulated by both the Response and the petition itself: such discussions have been going on for the past 5 years. 

Yes, it’s tough.  But the sky isn’t falling.  Look, both sides of the debate are filled by smart and well-meaning scholars.  Is the topic at hand—implementing the right kind(s) of transparency in research—a hard task?     Yes.    …And all involved acknowledge that, even if only because denying it would be ridiculous.

Any Good Transparency Standard Requires and Relies Upon Context. Why is this a hard task? Because there’s no perfect answer. Transparency is a beguiling concept, especially to scholars. To beguile implies at least a strong possibility of deception (which is ironic) and the allure of transparency fits this bill, precisely because “transparency” is like obscenity: you know it when you see it, because when you see it, you can account for the context. If a statue of a nude person is made of marble, it’s totally okay: not obscene. If you withhold data because the IRB (or contract, law) requires you to do so, or because revealing it would put people in harm’s way, that’s okay: still transparent. Just tell the editor(s) and reviewers (and, by extension) readers why.  This is a collaborative enterprise, this search for knowledge and betterment.  In the end, we’re in this together.

Look, This Ain’t A Democracy.  Finally, and I think most importantly, note that editors can and do impose policies about topics like this. Simply put, the petition is silly because journals and their editors do (and should) have discretion: that’s why we don’t have one big “JOURNAL OF RESEARCH” that everybody publishes in.

More specifically, and as the Response states,

It is important to note that JETS does not create new powers for journal editors. Instead, it asks them to clarify or articulate decisions they are already making or attempting to manage. Journal editors have had, and will continue to have, broad discretion to choose what they will and will not publish and their basis for doing so. (Emphasis added…twice.)


This isn’t about quantitative versus qualitative.  The petition draws a false, and all too commonly drawn, line in the sand.  The Response—and clear thinking—makes clear that neither the issue of transparency nor reproducibility differentially impinges on scholars due to the nature of their data or their method.  Data is data, method is method.  Sure, the implementation details of how best to achieve transparency will vary from one study to another—but this is based on the subject, not the nature of the data or method.  A method is something that can be done…you know…methodically.  That doesn’t require numbers.  Write down your method.  Share your data to degree that is legally and ethically possible.  Stop being fearful.  If none of that works, ask the editor for an exception.  If all of those steps fail…publish it somewhere else.  You can be like John Fogerty, Trent Reznor, or Prince.

This petition is cynical.  In the end, there’s no fire in that barn: somebody else is just blowing a lot of smoke from behind it. The petition is a manipulative force both playing upon and probably driven by fear.  Hopefully either the Response or maybe even even this post makes clear that this fear is unwarranted.

In the end, “haters gonna hate,” and, as a corollary, “editors gonna reject.”

Neither the DA-RT initiative, nor the petition, will change either of those truisms.

With that, I leave you with this.

Super PAC (Bites) Man

Rick Perry’s campaign seems to be a little strapped for cash.  But, his super PACs have plenty of money. What gives?  Is this just bad management, or possibly a systemic regularity tied to the hot mess that is the race for the GOP presidential nomination?

It’s no secret that super PACs have changed the nature of the (early) election cycle.  They are currently taking in over 80% of the campaign contributions.  While this disparity is understandable (super PACs can accept unlimited donations from a single individual, whereas candidates can essentially accept no more than $5400 from any individual and $5000 from any PAC—see here), it is nonetheless striking.

Though the super PACs are well-funded, Perry’s support to date is apparently quite narrow.  Some have interpreted this as a problem with/for Perry, with which I don’t disagree, but I want to forward a different story.  Namely, I think that the narrowness of that support is at least possibly by design.  Not by Perry’s design, but rather by goals of the donors.

Super PACs are easily created and highly flexible.  They work by spending to directly affect elections, and though the ones discussed in the current media cycle are associated “with” a particular candidate, they are not bound to hold true to that association.  More importantly, as Perry’s current situation lays bare, it is actually fairly difficult for a super PAC to step in and bail out, even indirectly, a flagging campaign.  This is because of the 120 day “cooling off period” (see here) that the FEC requires before a former employee of a campaign can be “involved with independent expenditures” (e.g., hired by a super PAC). This arms-length restriction bolsters the independence of the super PACs—from the candidate(s) with which they are associated—and solidifies the sway held by a super PAC’s mega-donor.

The proliferation of super PACs is probably contributing to the bulge of GOP candidates, but the real impact of the change is not that big money is “taking over” politics.  Rather, the new wild, wild west of campaign finance has lowered the cost of entry into an all-pay auction of sorts: the evidence is clearly consistent with a story of “lots” of rich people seeking influence over the election, but the more interesting story is how these mega-donors are seeking it.  Mostly, they aren’t bidding for the same candidate’s attention.  Instead, they are jump-starting “new” campaigns.  While this might seem to imply that these mega-donors are trying to buy “their own man” into the White House, I think that it is actually better thought of as a branding strategy.  Right now, Perry’s super PACs are deploying staff and ads in Iowa (see here, for example).  Perry is polling horribly among GOP voters in Iowa (less than 1% in today’s poll—see here).  Why spend the money here?  Why spend the money on Perry at all?  Because if it works even a little, these mega-donors—and their super PAC organizations—will have more leverage bargaining with the real contenders for the nomination.

Spending money on Perry in Iowa has a great “upside” for the super PACs in terms of demonstrating their effectiveness.  Perry’s rise, if it occurs, will

  1. Look dramatic—if he polls at 2%, then his support will have doubled.
  2. Be nearly solely attributable to the super PACs, because nobody else is fighting for Perry.[1]

Together, Rick Perry is kind of like Atari or Polaroid—brand names that have positive name recognition but are available on the cheap—and presents a great opportunity for a mega-donor (and his or her campaign staff) to demonstrate their expertise, build their clout.  Running a campaign is hard, and the proliferation of mega-donors lays bare something that political scientists have known for a long time: money is a necessary, but not sufficient, condition for electoral success.  There’s “plenty” of billionaires who love attention and care about politics.  But, by definition, there are precious few “top campaign organizations.” Electoral politics is a competitive sport, and what matters is not how much money or talent you have, but how much more you have than your competitors.

If you’re depressed by the money in politics, take heart: there are two awesome parts of this take on the new reality.  First, these mega-donors are (at least partially) throwing their money around fighting one another. Second, the people being played hardest are the megalomaniacal politicians who are spending (a lot of) their own time running essentially “trial balloon campaigns.”  In other words, while super PACs might have at first seemed like a boon for candidates who sought relief from the constant need to raise money in relatively small increments from lots of donors, it seems now that they have the potential to eat exactly those candidates by being

  1. infinitely lived,
  2. legally untied to any specific campaign, and
  3. operationally having a “120-day cooling off period” barrier to insulate themselves.

Super Pac-Man came out 33 years ago, the second sequel to Pac-Man.  Quoting wikipedia, the link may be deeper than simply nomenclature:

[Super Pac-Man’s] new gameplay mechanics were considered by many to be confusing, and too much of a change from the original two games. In particular, when Pac-Man transforms into Super Pac-Man, he was thought by some to be much more difficult to control.

Life imitates art, perhaps.  With that, I leave you with this.

[1] In addition, Perry’s campaign clearly isn’t going to be credited with any bump in the poll numbers, because it’s broke.  That raises other moral hazard problems (super PAC for candidate X might want to starve candidate X’s campaign) that are interesting, but I’ll leave them to the side for now.